Data Watch 
See also: Debugging Functions in Advanced Ladder
See also: Debugging Functions in IEC
Topic Menu
Data Watch Overview
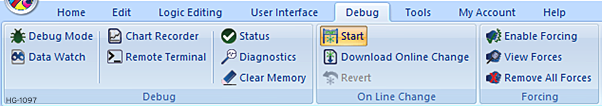
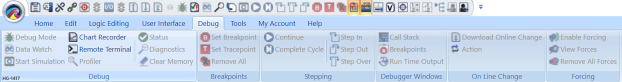
Data watch in Cscape provides the capability to monitor, in real-time, the status of registers/variables in a controller. This is valuable for troubleshooting, as the live, real-time values of the registers/variables can be viewed and changed at run time. Data watch can be accessed from Debug > Data Watch
Debug Advanced Ladder
Debug IEC
Shortcuts - Data Watch
-
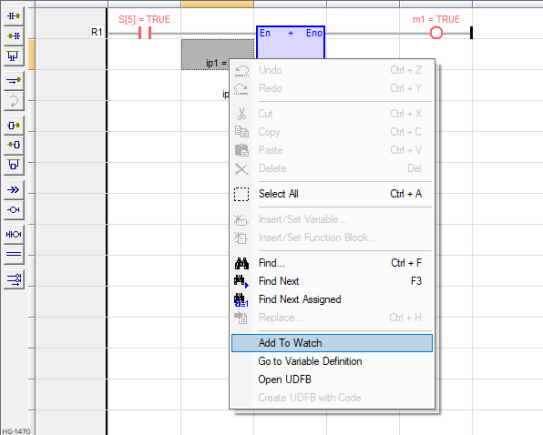
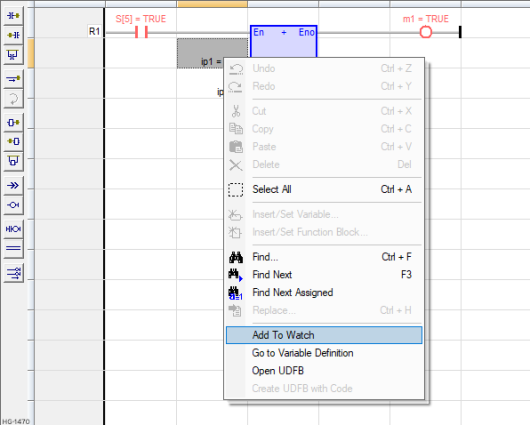
Select any ladder block in the main window (.CSP file) and right-click. Select Add To Watch. In this method, the Data Watch window will be displayed and simultaneously values get added to the Data Watch window automatically.
-
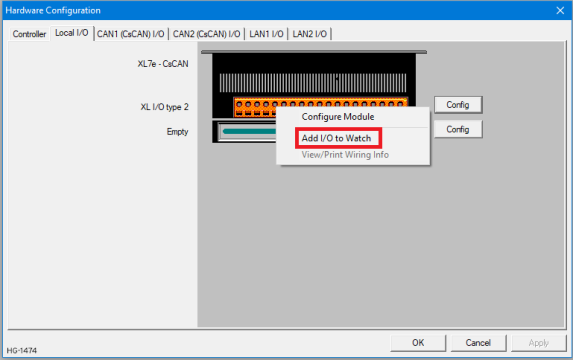
Select Home > Hardware Configuration > Local I/O tab. If there is any IO card connected, then right-clicking on IO card provides the option “Add I/O to watch”. Selecting this option opens the Data Watch window and data gets added to the Data Watch window simultaneously.
Return to the Top: Data Watch
Add New Element - Data Watch
In the Data Watch window, click on the Add button. Select an Element dialog will be displayed which is used to add a new element to the watch window.
Multiple consecutive elements can be added to the data watch by specifying a range of Register/variable addresses up to 128 at once.
For example, to add %R1 to %R20, enter R1-20 in the address field.
- Address – Register/Variable address that needs to be added to the watch window.
- Name – User defined name of the Register/Variable address
- Type – Data type or format of the Register/Variable address. See Format section below.
- Note : Maximum number of elements that data watch window can occupy is 128.
Return to the Top: Data Watch
Format for Data Watch
To set the display format, right-click on the element, and then select Format and desired format type, or highlight an item in the list and use a shortcut.
The following formats are available:
- BOOLEAN
 Boolean- [Data Type BOOL] - A single bit, binary value, or register/variable. Boolean points have only two possible values, 'TRUE' or 'FALSE'. <B> Treats the register/variable as a single bit and displays either "ON" (1) or "OFF" (0).
 - BINARY <Ctrl + B> Treats the register/variable as an array of 16 single bits.
- HEX A base-16 numbering system which uses the symbols 0, 1, 2, 3, 4, 5, 6, 7, 8, 9, A, B, C, D, E, F for numeral. <H> Treats the register/variable as a single 16-bit Integer and display the number in hexadecimal format.
- INT Integer - [Data Type INT] - A 16-bit signed value. Integers are used where the value of the data is expected to be in the range of -32,768 to +32,767. <I> Treats the register/variable as a 16-bit Signed Integer and displays the value in the range -32768 to +32767.
- UINT Unsigned Integer - [Data Type UINT] - A 16-bit unsigned value. Unsigned Integers are used where the value of the data is expected to be in the range of -0 (zero) to 65,535. <U> Treats the register/variable as a 16-bit Unsigned Integer and displays the value in the range 0 to 65535.
- DINT Double Integer - [Data Type DINT] - A 32-bit signed value. Double Integers are used where the value of the data is expected to be in the range of -2,147,483,648 to +2,147,483,647. <Ctrl + I> Treats the register/variable as a 32-bit Signed Integer and displays the value in the range -2,147,483,648 to +2,147,483,647
- UDINT Unsigned Double Integer - [Data Type UDINT] - A 32-bit unsigned value. Unsigned Double Integers are used where the value of the data is expected to be in the range of 0 (zero) to 4,294,967,296. <Ctrl + U> Treats the register/variable as a 32-bit Unsigned Integer and displays the value in the range 0 (zero) to 4,294,967,295
- ASCII ASCII - American Standard Code for Information Interchange - ASCII-coded characters are single-byte values in the range of 0 (zero) to 127. Codes in the range 128 to 255 are not defined by the ASCII standard, but rather by the equipment manufacturer. <A> Treats the register/variable as two 8-bit registers containing ASCII codes. For example – If a register/variable contains an ASCII characters like “ab”, “a” will be high byte and “b” will be low byte. When the same is converted to Hex A base-16 numbering system which uses the symbols 0, 1, 2, 3, 4, 5, 6, 7, 8, 9, A, B, C, D, E, F for numeral., the value will be 16#6261, where 62 indicates ASCII character b and 61 indicates ASCII character a. NULL Null Termination - To place a NULL character (character code 0) at the end of ASCII data. Some functions require NULL Termination to be able to determine the end point of the ASCII data since that data may vary in length from one time to the next. character in ASCII is the control character which holds a value zero. It’s the terminating character.
- REAL REAL: Single precision floating point value - Real constant expressions must be valid number, and must include a dot ("."). If the user needs to enter a real expression having an integer value, add ".0" at the end of the number. The user can use "F" or "E" separators for specifying the exponent in case of a scientist representation. REAL is the default precision for floating points: such expressions do not need any prefix. <R> Treats this register/variable as a 32-bit IEEE-format floating point number.
- LREAL These numbers use IEEE 754-1985 format to store numbers in following ranges.
32-bit single-precision floating point (REAL) – -3.40282E+38 to +3.40282E+38
64-bit double-precision floating point (LREAL) – -1.79769E+308 to +1.7976E+308
Floating Point refers to both REAL and LREAL data types. <L> Treats this register/variable as a 64-bit IEEE-format double floating-point number.
- IP Address IP Address - Internet Protocol - This is the address of a device on an Ethernet or Wi-Fi network. Horner controllers currently use IPv4 standards with addresses consisting of 4 numbers, or octets, separated by decimal points. <P> Treats this register/variable as a 32-bit IP address and displays the IP address.
Return to the Top: Data Watch
Modifying an Element in Data Watch
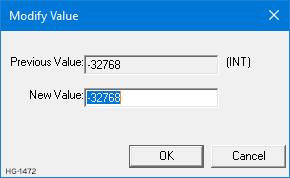
For debugging purposes, an element's value can be changed in real-time, as long as the program is not controlling/overwriting that variable. From the Data Watch window, right-click on an element, and from the pop-up menu, select MODIFY or double click on an element and the following window will be displayed. Enter the desired value in the New Value box.
Note:
-
BOOL entries can be changed to ON/OFF or 1/0 for the same effect.
-
In order to select multiple entries, a user can drag a selection over multiple entries or can click on one item in the list then select shift from keyboard and click on another item in the list, all the entries between those entries will be selected.
Delete an Element from Data Watch
To delete an element from the list, right-click on an element, and then select Delete or select an element and choose delete key from keyboard.
Return to the Top: Data Watch
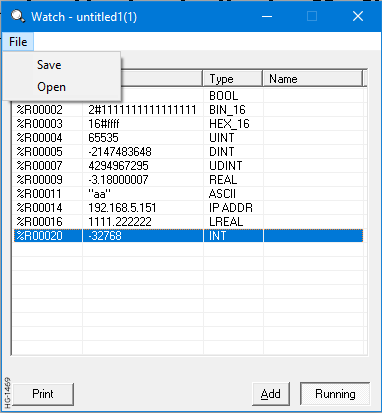
Saving and Opening Watch List
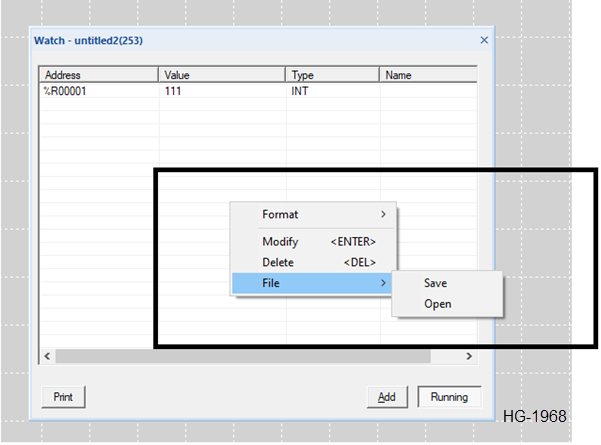
Selecting File > Save menu from the watch window, the list of registers/variables added in the data watch window can be saved. The file will be saved with a .csw extension.
Selecting File > Open menu on the watch window allows opening of a previously saved .csw file.
Note: Save/Open option is not available in IEC program language.
Data watch in IEC programming Language: Data watch in IEC programming language will get enabled only when Debug/Monitor mode is enabled. See also: Debug and Monitor
Variables can be added to the Data watch window by any one of the ways.
-
Select any variable in the main window (.CSP file) and right-click, select Add To Watch. In this method, Data Watch window will be displayed and simultaneously values get added to the Data Watch window automatically.
-
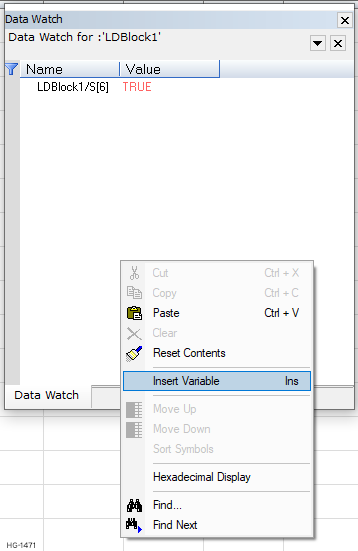
Right-click in the Data watch window and select “Insert Variable” to add variables.
NOTES:
-
The Save/Open option is not available in IEC program language.
-
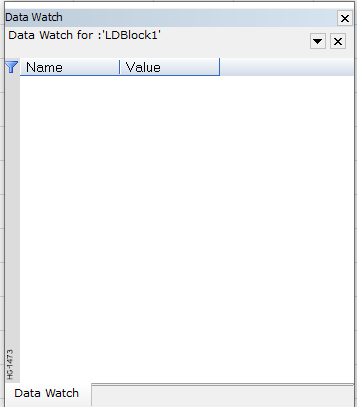
From Cscape 10.2 SP1 onwards, the Data Watch window is a dockable dialog. Menu options are not supported in dockable dialogs, so the Save and Open options are available on the right-click of Data Watch. Refer to below screenshot –
Return to the Top: Data Watch
Controls - Data Watch
The dialog and columns can be resized using standard Windows techniques. To do so, move the cursor to any edge or corner of the window until a double-headed arrow appears. When this arrow appears, click-and-drag it to make the window larger or smaller. Resizing may be necessary to allow a complete display of all information, especially that in Binary format.
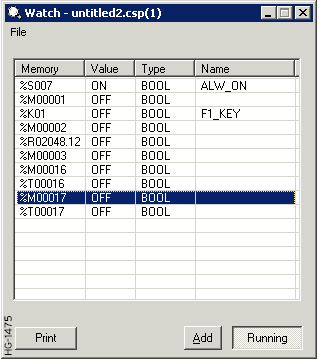
The column headers can be moved by dragging and dropping. This allows the user to change the order of the columns. For example, the columns can be reordered to:
Address | Value | Name | Type from the default display Address | Value | Type | Name
-
Add - This button is used to add a new element to the Data Watch window.
-
Running - This option indicates that the Data Watch is communicating with the controller and gathering the selected register/variable values. Clicking this button changes the label to Halted, and the Data Watch communications are stopped.
Note: The window background turns yellow when stopped.
-
Print – This button is used for printing the contents available in data watch window.
-
Address, Value, Type, Name – Clicking on these column headers sort the list of items according to the header selected.
Return to the Top: Data Watch