Debug and Monitor 
See also: Debugging Functions in Advanced Ladder
See also: Debugging Functions in IEC
Topic Menu
Navigating to Debug and Monitor
Two ways to enter Debug Mode:
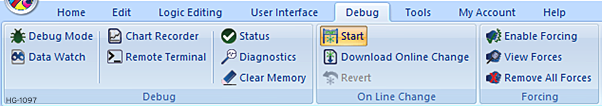
Option 1: Cscape provides a built-in Ladder Logic Debugger. This option provides a live, real-time indication of the operation of the controller. Can be found at Debug > Debug/Monitor. NOTE: Debug/Monitor also acts as a toggle button to turn on or turn off debug functionality.
Debug Advanced Ladder
Debug IEC
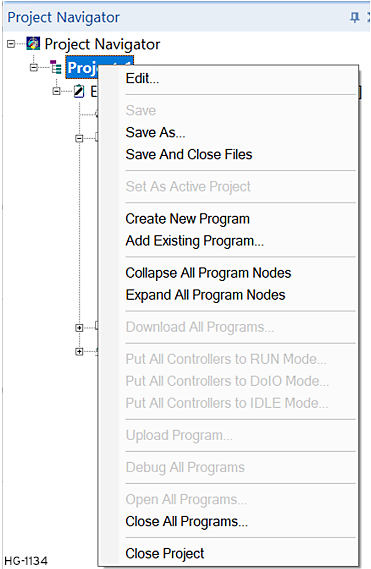
Option 2: Another way to enter Debug mode is to right-click on the Project OR Program name in the Project Navigator and select Debug All Programs from the menus displayed.
Debug and Monitor Procedure
Once user selects Debug / Monitor, a small “bug” symbol appears on the logic editor as shown and also Debug/Monitor option in toolbar will be highlighted indicating that program is in debug mode.
![]()
Once program is in debug mode, user can view the runtime values and modify as per the requirement.
Debug Mode Example
When program is in debug mode, the ladder blocks appears as shown. Here the contacts in Red color indicates that inputs are true / high and the contact is closed. Coils in Red color indicates that contact is energized. The values in red indicates the real time values in the configured register/variables.
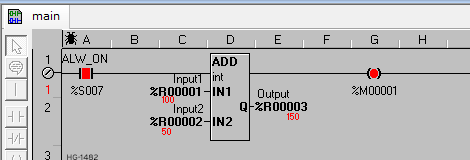
Here, user can view the runtime values and modify the values using Data watch.
NOTE:
- In debug mode, up to four logic modules can be opened at once.
- If more than four logic modules are opened, then Cscape pops up an error window.
Restrictions While in Debug Mode
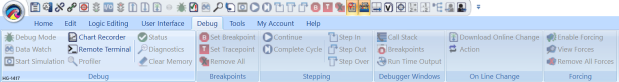
Most of the functions will be grayed out except the following options:
- Home Menu – Upload, Run, Stop, DO I/O, Project navigator, project toolbox, Output window, Messaging, audio, Setpoints, Find, Select All, Find and Replace will be available.
- System Menu – All options are available
- Debug Menu – Data Watch, Debug/Monitor, Set Breakpoint, Set Tracepoint, enable forcing, View forces, remove all forces will be available
- Tools Menu – Search Network will be available
To exit Debug mode, select the Debug / Monitor option.
Limitation (Real-Time Response)
- If user use serial port as default programming port, then the timings and delays associated with a serial port introduce a limit on how much information can be read from the controller in any given time period.
- The major effect of this limit is that inputs or outputs which change very fast can be missed. The visual results are inputs or outputs that appear to be stuck ON or OFF or appear intermittent. This is unavoidable.
- The real-time response of the Debugger is still maintained. The information display (contacts ON or OFF, counter values, etc) are accurate as of the last time the value was read. The display does not necessarily match the current state of the elements because of communications delays.
- Active Logic between the monitored functions and the end of the OCS scan may override the values in the monitored function if they use the same variables. Only the state of variables at the END of the OCS scan are shown in Debug mode.
Return to the Top: Debug and Monitor