Trend Object for Canvas 
Note: For Canvas Series only. For all other series, see Trend Object .
See also: User Interface
See also: Graphic Object Toolbox for Canvas Series
Topic Menu
Overview of the Trend Object

|
Using Trends |
The Trend Object creates and formats a Data Trend which tracks one or more variables over time. Four types of trend boxes are available. Up to 4 trends (registers) can be graphed in each Data Trend Box using Configure Pens. A Trigger address is required to activate the trending process for each Data Trend Box.
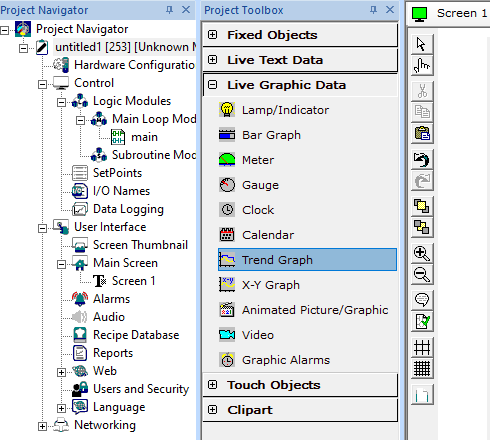
The Trend Object can be accessed through the Screens Project Toolbox > Live Graphic Data > Trend Graph. User must be on a Screen and not in the Main work area in order to see the Objects Project Toolbox items. Select the Trend Graph object and drag to a new screen. This object can be placed anywhere on the screen.
Trend Object Configuration
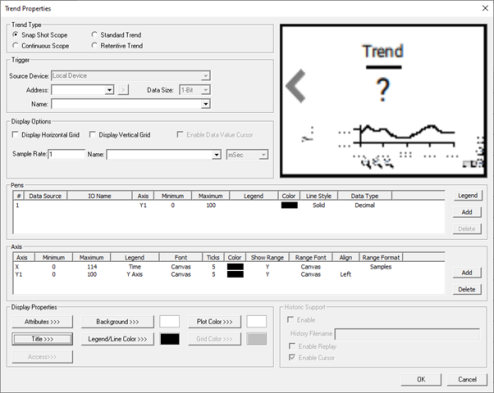
Trend Type
Snap Shot Scope (high speed) - This mode allows capture of up to one object display’s width of data after triggering. Object is only active and can only hold data while its associated screen is being displayed. Minimum sample rate is 10mSec.
Continuous Scope (high speed) - This mode allows continuous updating of data after trigger (screen scrolls once display width full). Object is only active and can only hold data while its associated screen is being displayed. Minimum sample rate is 50mSec.
Standard Trend - This mode allows continuous updating of data after trigger regardless of whether the object’s associated screen is being displayed. Additionally, object’s screen does NOT need to be displayed for trigger control. Screen containing object only needs to be visible for viewing data. If trending is continued through a RUN-STOP-RUN cycle, a vertical dashed line marks that event in the trend data.
Retentive Trend - Behaves as Standard trend with the exception that the object’s last display width of data is retained in battery-backed memory and is restored to the object at power-up. If the trend is running at the power-cycle, a vertical dashed line marks that event in the trend data.
On the horizontal axis of the object’s trend display area, each sample consumes one screen pixel’s width. The editor will display the width and height (respectively) of the object’s trend display area in a small white box on the trend object. The user may use the width dimension to determine the total number of samples that the trend object can display.
There is a limit to the number of standard and retentive type trend objects supported in a program.
Note:
-
The limit is actually based on the number of configured pens which is 4 or 16 or 64 (depends upon the model selected) for the retentive trends and an overall limit of 32 or 64 pens (depends on the model selected) for any mix of standard and retentive trends.
-
ZX / XL4 / XL7 / EXL10 / EXL6 / EXLW/ XL15+ Models (including the Prime and Canvas Series) support 64 retentive trends (i.e., 64 trend object with 1 pen configured in each or 16 trend object with 4 pens configured in each)
-
X5 supports either 1 trend object with 4 pens configured or 4 trend objects with 1 pen configured in each.
-
XLE/XLE/XLEe/XLEe, X2, X4, X7 & X10 support 16 retentive trends (i.e., 16 trend object with 1 pen configured in each or 4 trend object with 4 pens configured in each).
Trigger
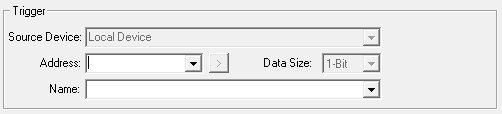
Trigger - OCS register (1-bit) reference which controls when trend is active, halted or cleared. Once triggered, the control register for each of the defined pens is sampled at the specified sample rate and plotted to the objects display area. Triggering is level sensitive in that the trend will be active while the trigger is high and the OCS is in RUN mode. In all modes trending will cease when the trigger register is set low. On the detection of a low-to-high transition of the trigger by the object, previous trend data will be cleared before the new trace begins. On RUN-STOP-RUN cycles, previous trend data will NOT be cleared and trending will continue if the associated trigger was maintained high through the transition (assumes NO screen change for snap-shot and continuous modes).
Each control register value is treated as a 16-bit signed value and vertically scaled (and limited) to the Y-Min and Y-Max values presented in the Axis dialog.
Display Options
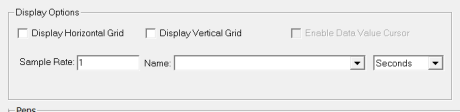
Display Horizontal Grid – Selecting this option displays the horizontal grid on the trend graph object.
Display Vertical Grid – Selecting this option displays the vertical grid on the trend graph object.
Sample Rate - Elapsed time between samples. Generally, units are variable between 1-9999 while the Base is dependent on the trend type. For standard and retentive trends the base is selectable between Seconds, Minutes and Hours. For the other trend types, the base is limited to Milliseconds only.
Pens
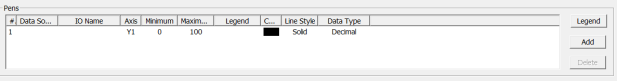
Configure Pens - Accesses dialog for specifying the number of pens and each pen’s associated control register. Up to four pens can be specified with one of four styles (Dash, Dash Dot, Dot and Solid).
-
# - Displays the number of pens
-
Data Source – Displays the configured Register / Variable
-
IO Name – Displays the configured IO Names for each of the register / Variable.
-
Axis – Displays the configured Y axis to plot the values
-
Minimum – Minimum values to plot
-
Maximum – Maximum values to plot
-
Legend – Displays the configured legend text for each pen
-
Color – This is the Pen color configured
-
Line Style – Displays the configured line style for each pen. Following line styles are available –
-
Dash
-
Dash dot
-
Dot
-
Solid
-
-
Data Type – Displays the configured data type to plot the values. Following data type are available –
-
Decimal
-
LREAL
-
REAL / Floating point
-
Signed decimal
-
-
Add – Selecting this option adds pens to the pen configuration window.
-
Note – Maximum of 16 pens are supported and can be configured.
-
Delete – Removes the selected pen from the list.
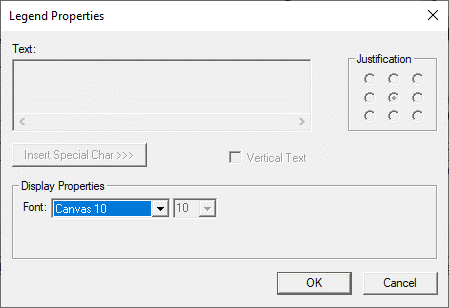
Legend
Selecting this option displays the following legend properties window wherein user can configure Pen legend text font type and size.
Axis
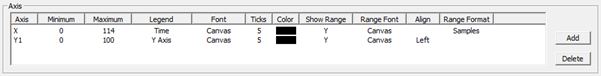
Axis Properties (button) -
-
Accesses dialog for defining each axis label, limits (Y-scaling) and tics.
-
Negative limits can be assigned to Y axis to enable Negative value plotting in the range of 32767 to -32768.
Axis – Displays X and Y axis that are configured.
Minimum – Displays the minimum range of X and Y axis accordingly
Maximum – Displays the maximum range of X and Y axis accordingly.
Legend – Displays the configured legend text for each axis.
Font – Displays the configured legend text font type and size.
Ticks – Displays the number of ticks that is configured for X and each Y axis.
Color – Displays the configured color to each axis lines
Show Range – Displays the axis range depending upon the selection - Y (Yes) or N (No)
Range Font – Displays the configured font type and size for range.
Align - Displays the alignment (right or left).
Add – Selecting this option adds Y axis to the Axis configuration window.
Note: Maximum of 4 Y axis is supported and can be configured.
Delete – Removes the selected axis from the list.
Note: Deletion of X axis is not allowed.
Display Properties for Trend
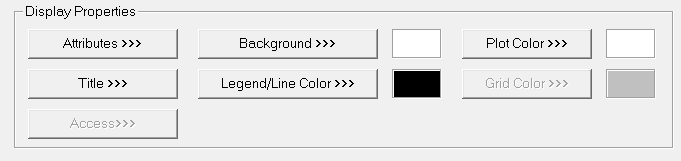
Attributes >>>
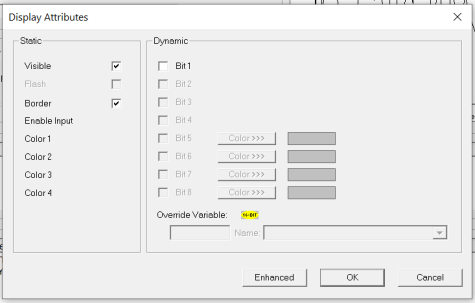
Static
Visible
Non-touch units* - all objects are always visible, so as a result both the static and dynamic override fields will be grayed out.
Touch units** - the visibility attribute may be set as static or dynamic.
*Non-touch units include X2, XLE, and XLEe.
**Touch Units include all XL series, Prime Series, and Micro OCS series controllers.
When the attribute is statically set to ON, the object is always visible and always responds to touch signals.
When the attribute is statically set invisible (unchecked) the object is not drawn but if the object is the front most object it responds to touch signals. For example, placing a statically invisible screen jump object in front of a bitmap allows the bitmap to be drawn but touching the location of the invisible screen jump causes the screen jump action to be performed.
When this attribute is dynamically enabled the visibility of the object is controlled by the associated bit in the override register. When the bit is ON the object is drawn and operates normally. When the bit is OFF the object is not drawn and does respond to any touch signals.
Border – This attribute, available only statically, provides a decorative border (rectangle) drawn around the inside of the objects bounding rectangle. This border is typically removed to allow either a more elaborate border to be drawn with the drawing primitives or no border at all.
Enable Input – This attribute, optionally available only as dynamically overridden, allows the object or the object editor to ignore keystrokes directed to that object. This allows run-time determination on whether to restrict input access to that object. This allows the user to create operator privilege or in-motion lockout of object modification. If this box is NOT checked, the associated object always accepts input.
Color – This attribute allows some objects to dynamically change colors. Up to four additional colors can be selected for an object. If none of the color attribute override bits are set the object defaults to the color chosen in the main object properties.
Dynamic
Override variable – This register / variable is used to control the dynamic properties like visible, Flash, Enable Input and Colors.
Enhanced - Selecting Enhanced button displays the following window:
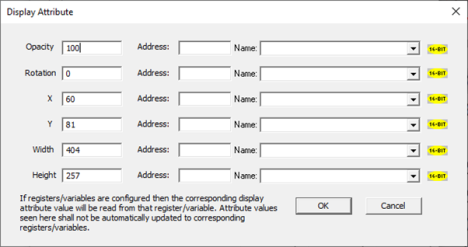
This option is used for configuring the different display attribute of graphic objects mentioned below. The following options can be configured either using constant values or via register / variable.
Opacity – User can configure the display opacity of graphic object. Range is 0 to 100.
Rotation – User can configure at what degree the object should appear rotated. Range is -180 to 180.
X and Y axis – User can configure at what X and Y axis the object should be placed on the screen. Range depends on the model selected.
Width and Height – User can configure at what width and height the object should be displayed on the screen. Range depends on the model selected.
Title >>>
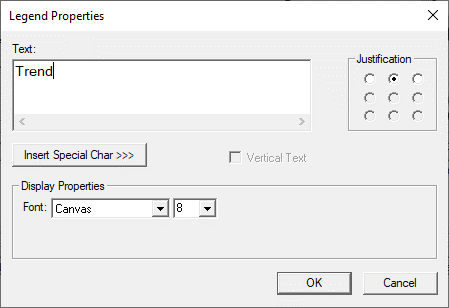
Text – User can configure a descriptive text (legend) to be included with-in the objects bounding rectangle. Returns may be inserted for multiple lines.
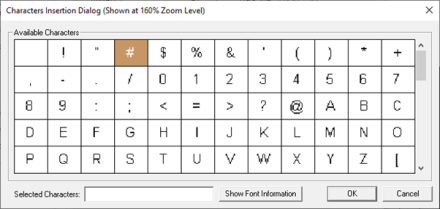
Insert Special Char >>> - Selecting this option displays the following window wherein user can select different fonts / special characters available to be added in legend.
Justification – This option is used to display the legend text in the configured position within a graphic object.
Font – User can select the available fonts / font size to be applied to legend text.
Background >>>
Note: Only solid color is available for trend graph background color. Other background options like gradient, pattern and User image are disabled.
Solid Color
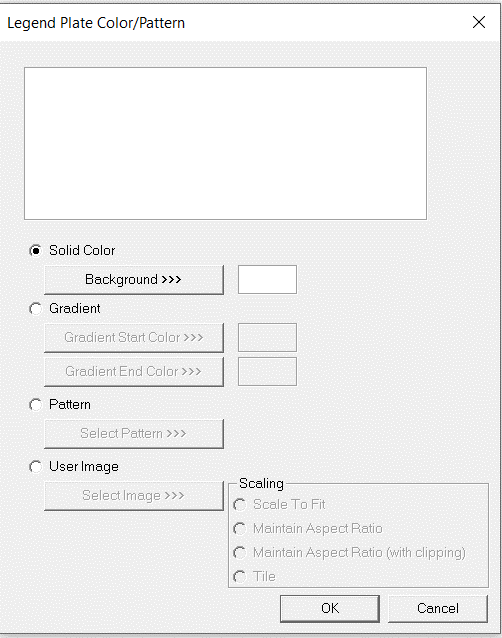
Color Picker
Applies the selected color from color picker as solid background color for the graphic object.
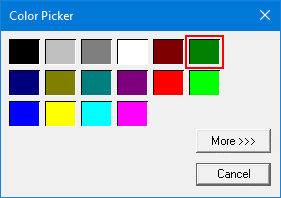
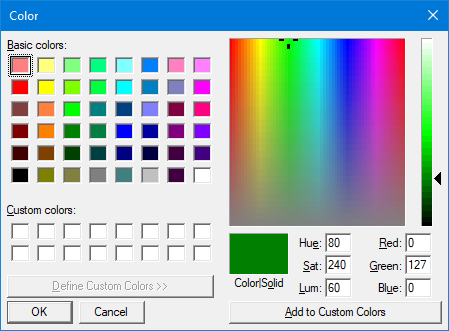
Selecting More >>> displays the following window allowing user to select color apart from default colors available in the above displayed color picker window.
Legend / Line Color >>>
Selecting Legend / Line Color >>> option displays the Color Picker dialog for user to select the color and this will be applied to the legend and line (boundary) of the graphic object.
Plot Color >>>
Selecting Plot Color >>> option displays the Color Picker dialog for user to select the color and this will be applied to the color of plot area where values will be plotted.
Historic Support
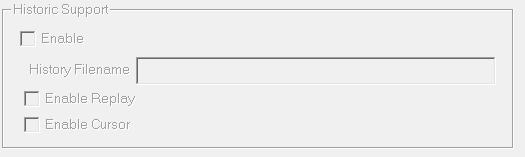
History Filename:The user specifies a file name here. A directory followed by year in YY format will be created in the removable media at the time of logging. Separate files are created in the named directory on the following basis:
-
Hourly if the sample rate selected is seconds.
-
Daily if the sample rate selected is Minutes / Hours.
Enable Replay - In Cscape if 'Enable Replay' option is selected then the following options appear on trends graphic object on controller.
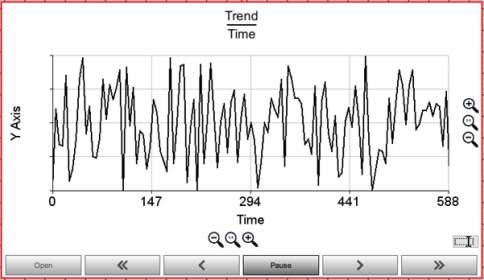
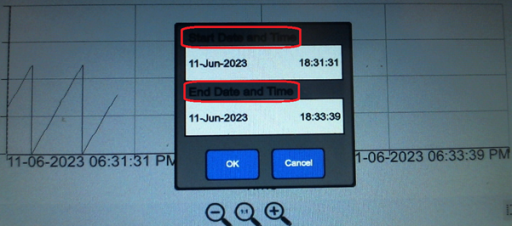
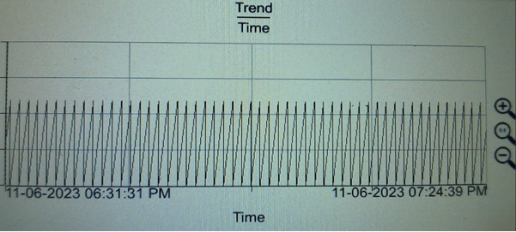
Open – This option will be enabled when the current trends display is Paused i.e, selecting Pause button enables Open button along with all other buttons. Selecting this option opens up Historic Trends window where user can configure Start Date and time / End Date and Time for which data needs to be displayed. This will facilitate the replay period of the historic trend to one minute, one hour, 12 hour, one day, one month and one year options. The whole data is compressed and displayed on a single screen.
An Example for 1 Hour data is as shown:
<< (Previous Page / Screen) - This button causes the data that is logged in the previous page / screen to be displayed.
< (Previous) - This button scrolls the data to earlier logged data.
Pause – Selecting this option pauses the display and the button text changes to “Play”.
Note: When the Pause button is pressed, the current trends data continue to be logged in the background. Pressing the play button causes the trending to recommence with the latest logged data.
> (Next) - This button scrolls the data to later logged data.
>> (Next Page / screen) - This button causes the data that is logged in the next page / screen to be displayed.
Note:
-
Any paused trend will automatically be released when scrolling away from the screen.
-
If multiple trend objects are present in single screen, then selecting pause button on any one object disables the pause buttons from other trend objects until the trend is resumed.
-
Logging large amount of data to the removable media will adversely affect the scan rate of the device.
Return to the Top: Trend Object for Canvas