Debug Windows in Enhanced IEC 
NOTE: This feature requires Enhanced IEC License.
See also: Debugging Functions in IEC
See also: Enhanced IEC 61131 Guide
Topic Menu
Note: User can debug any IEC program by setting breakpoints/tracepoints to the program.
Breakpoints 
A breakpoint is an intentional stop marked in the code of an application where execution pauses for debugging. A breakpoint helps to speed up the debugging process in a large program by allowing the execution to continue up to a desired point before debugging begins.
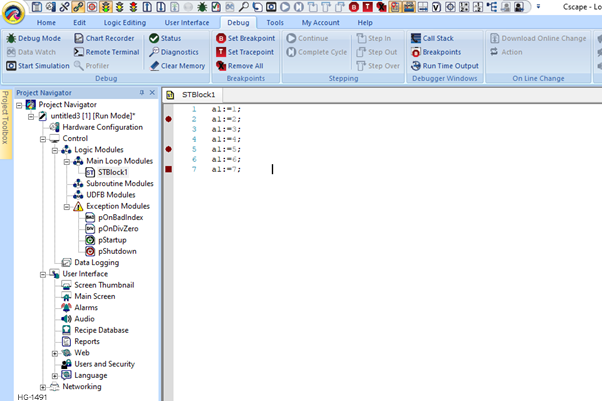
Pressing F9 will set/reset break points on Editor with red circle mark as shown below.
Note: Pressing F9 will not set/reset breakpoints on Ladder Language of Enhanced IEC and this is a limitation.
If the current position is not on a valid line for stepping, the breakpoint is automatically moved to the nearest valid position. Breakpoints can be placed in programs, sub-programs or UDFBs. They are not available in SFC programs.
User can see the list of active breakpoints in the Log Window or in the output window of an editor. From here user have the possibility to remove all breakpoints in a single command. At any moment user can double click on a breakpoint in the Log window to open the corresponding program at the breakpoint location.
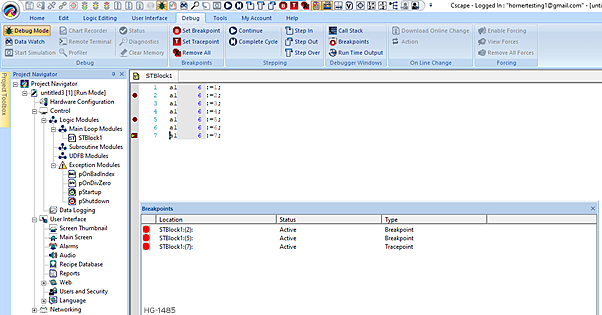
Breakpoints Window
When program is in Debug/Simulation mode and breakpoints set then it will hit break points with yellow triangle and user can see corresponding break/trace points. Only the point which hits the breakpoints will become as active breakpoints other display as Inactive.
Return to the Top: Debug Windows in Enhanced IEC
Tracepoints 
Tracepoints are similar to break points but rather than stopping the PLC scan, a message will be added in the runtime window at the time of execution. When a tracepoint is hit, the debugger performs the specified tracepoint action instead of, or in addition to, breaking program execution.
Pressing F8 will set/reset trace points on Editor with red square mark as shown below.
Note: Pressing F8 will not set / reset trace points on Ladder Language of Enhanced IEC and this is a limitation.
Note: User can check set breakpoints/tracepoints on the Breakpoint Window. Callstack and Runtime windows are used during debug/simulation for showing callstack and traced points.
Return to the Top: Debug Windows in Enhanced IEC
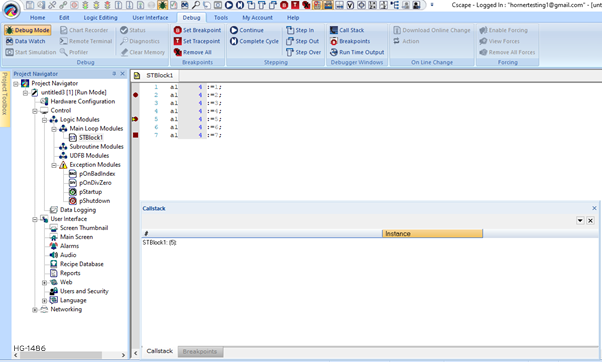
Call Stack Window 
When program is in debug/simulation mode and breakpoints set then it will hit break points with yellow triangle and user can see corresponding call stack. When stepping, the Call Stack is available in the Log Window or in the output window of editors. It shows the stack of called function blocks and/or sub-programs, from the top level calling program up to the current stepping position. For a UDFB, the Call Stack also indicates which instance of the UDFB is executed.
At any moment user can double click on a line of the Call Stack to open the corresponding program.
Return to the Top: Debug Windows in Enhanced IEC
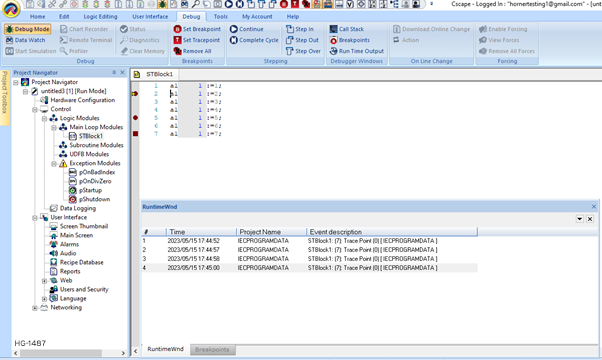
Runtime Window 
When program is in debug / simulation mode and trace points set then it will hit trace points and user can see corresponding traced points.
Return to the Top: Debug Windows in Enhanced IEC