Chart Recorder
See also: Debugging Functions in Advanced Ladder
See also: Debugging Functions in IEC
Topic Menu
Chart Recorder Overview
This feature allows Data to be sampled from a target controller and to be plotted over time.
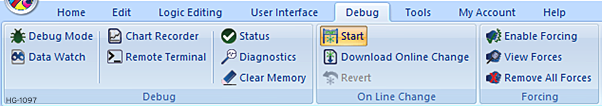
Debug > Chart
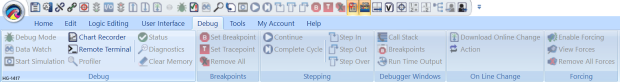
Debug Advanced Ladder
Debug IEC
Strip Chart 
Setup Strip Chart:
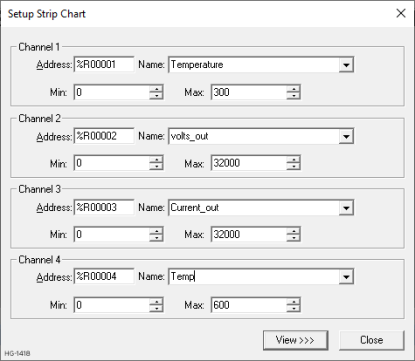
- Address and Name - This defines the register/variable to use as a source for data to plot.
- Channel Maximum - Displays the maximum value for the channel.
Note: If the value of the recorded data is greater than the maximum, it will be plotted as if it were equal to the maximum value.
- Channel Minimum - Displays the minimum value for the channel.
Note: If the value of the recorded data is less than the minimum, it will be plotted as if it were equal to the minimum value
- View - Pressing this button with display the strip chart.
- Close - This closes the dialog.
Return to the Top: Chart Recorder
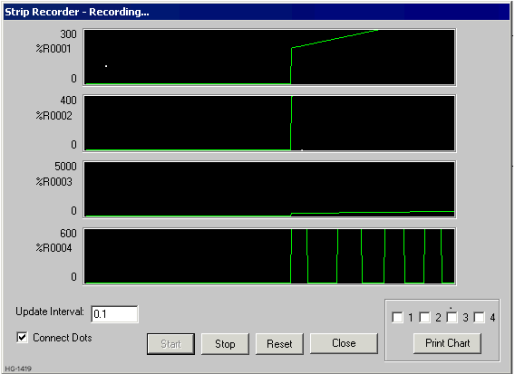
Strip Chart Recorder 
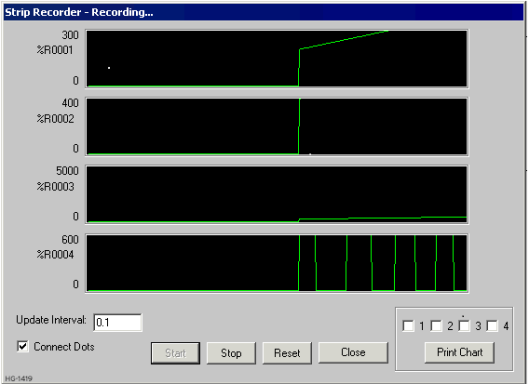
- Start - This starts recording data from the target and plots the data on the respective graphs. Recording is stopped by pressing the STOP button.
- Stop - This stop recording data from the target. Recording can be restarted by pressing the START button
- Reset - This clears the plotted data and time measurement bars
- Update Interval - This sets how often (in Seconds) the graph should be updated.
-
Print Chart - This button and check boxes allows any combination of the four channels of data to be printed
- Connect Dots - When this is selected, the data points sampled from the target are connected with line segments. If this option is not selected, each sampled data point Graphed with a single point.

Recorder Chart 
This dialog allows data to be sampled from a target controller and to be plotted over time.
Return to the Top: Chart Recorder